


I tested the Paessler PRTG Network Monitor - see what I thought of it
Why you can trust TechRadar We spend hours testing every product or service we review, so you can be sure you’re buying the best. Find out more about how we test.
Businesses concerned about the cost of add-on components and upgrades can rest easy with Paessler’s PRTG Network Monitor as everything is included in the price. Its sensor-based licensing means you just select the number you want and apply them to any device, individual hardware component, service or business application you choose.
Paessler offers a range of sensor packs. We’ve shown the price for a PRTG 1000 perpetual license, which includes one year of maintenance and should be sufficient to monitor up to 100 devices. You can easily upgrade to larger packs when required, and Paessler also offers a free version with 100 sensors.
Businesses with distributed offices may prefer the cloud-hosted version where they remotely monitor each network by installing PRTG probes in them. This is a subscription service, with a Hosted 1000 pack costing €229 per month.
We’ve been running PRTG problem-free in the lab for over eight years, with all updates automatically applied on their release. New users will find on-site installation undemanding: after loading the software it runs a wizard to assist with your first network discovery, taking around 45 minutes to scan a complete IP subnet.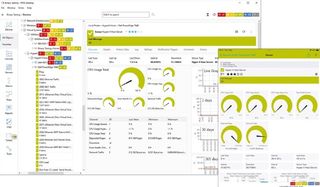
PRTG does all the legwork by assigning the most appropriate sensors to each device and applying a predefined set of alert triggers. The service has a sensor for every occasion, with Paessler currently offering nearly 300, and value looks even better since it includes options for monitoring all popular virtualization hosts.
Paessler estimates that most devices will use around ten sensors each, but it really depends on what type of hardware or system it is. Switches can be greedy, with our 24-port TP-Link Gigabit model awarded a total of 47 for its SNMP and RMON services, while our VMware ESXi 7 and Windows Server 2022 Hyper-V hosts plus all their VMs used up 79 sensors between them.
The good news is you can choose which components you want to monitor, delete those you don’t need and requisition them for use elsewhere, making PRTG more flexible than products that employ device-based licensing. Custom sensors can be added as required, and although those for Cloud HTTP, Google Analytics, Dropbox and Microsoft OneDrive monitoring have been discontinued, there’s still an incredible range to choose from.
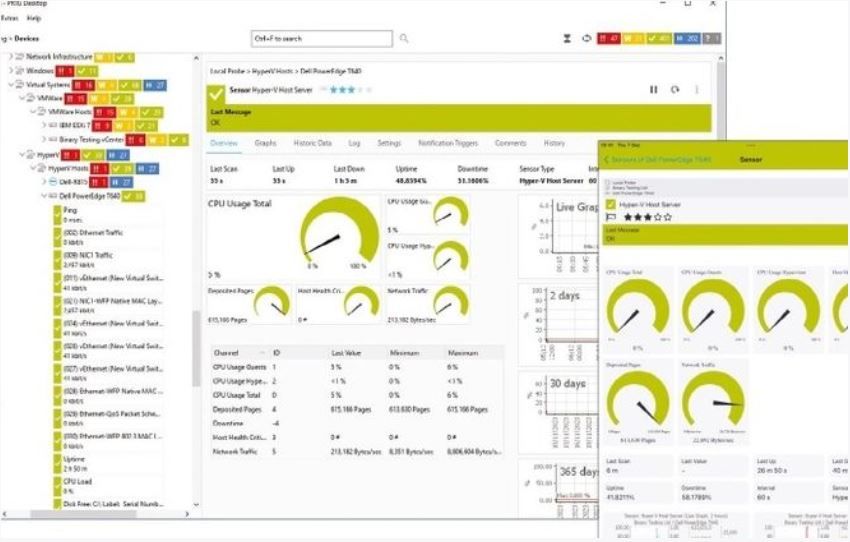
PRTG’s web console provides a network overview showing the status of all sensors, and clicking on any of their icons next to the donut charts takes you to a filtered view. The devices view uses a tree structure, with all systems neatly organized into hierarchical groups that inherit settings such as login credentials and discovery schedules from their parent group.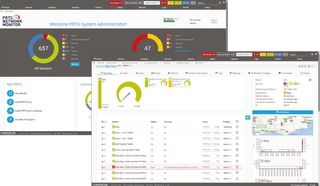
The view can be customized to suit your environment by adding new groups and moving monitored systems to them. It’s easy to identify problems as all sensors are assigned colors showing if they are up, down, paused or in a warning state, and selecting one takes you to a detailed overview with live graphs and charts showing activity for the past two days, month or year.
Plenty of alerting services are provided, as notification templates are available for services such as email, SMS, Syslog, SNMP traps, MQTT, Slack and Microsoft Teams. You can monitor PRTG on the move with Paessler’s excellent iOS and Android mobile apps and use the Windows and macOS desktop apps to view the same levels of information as the main web console.
You’ll need to keep an eye on consumption, but sensors make Paessler’s PRTG a highly versatile network-monitoring package. It delivers a wealth of information about pretty much anything on your network, and its all-inclusive price makes it a great choice for SMBs.
What's Your Reaction?
 Like
0
Like
0
 Dislike
0
Dislike
0
 Love
0
Love
0
 Funny
0
Funny
0
 Angry
0
Angry
0
 Sad
0
Sad
0
 Wow
0
Wow
0